- 🐝 The Investing Show
- Posts
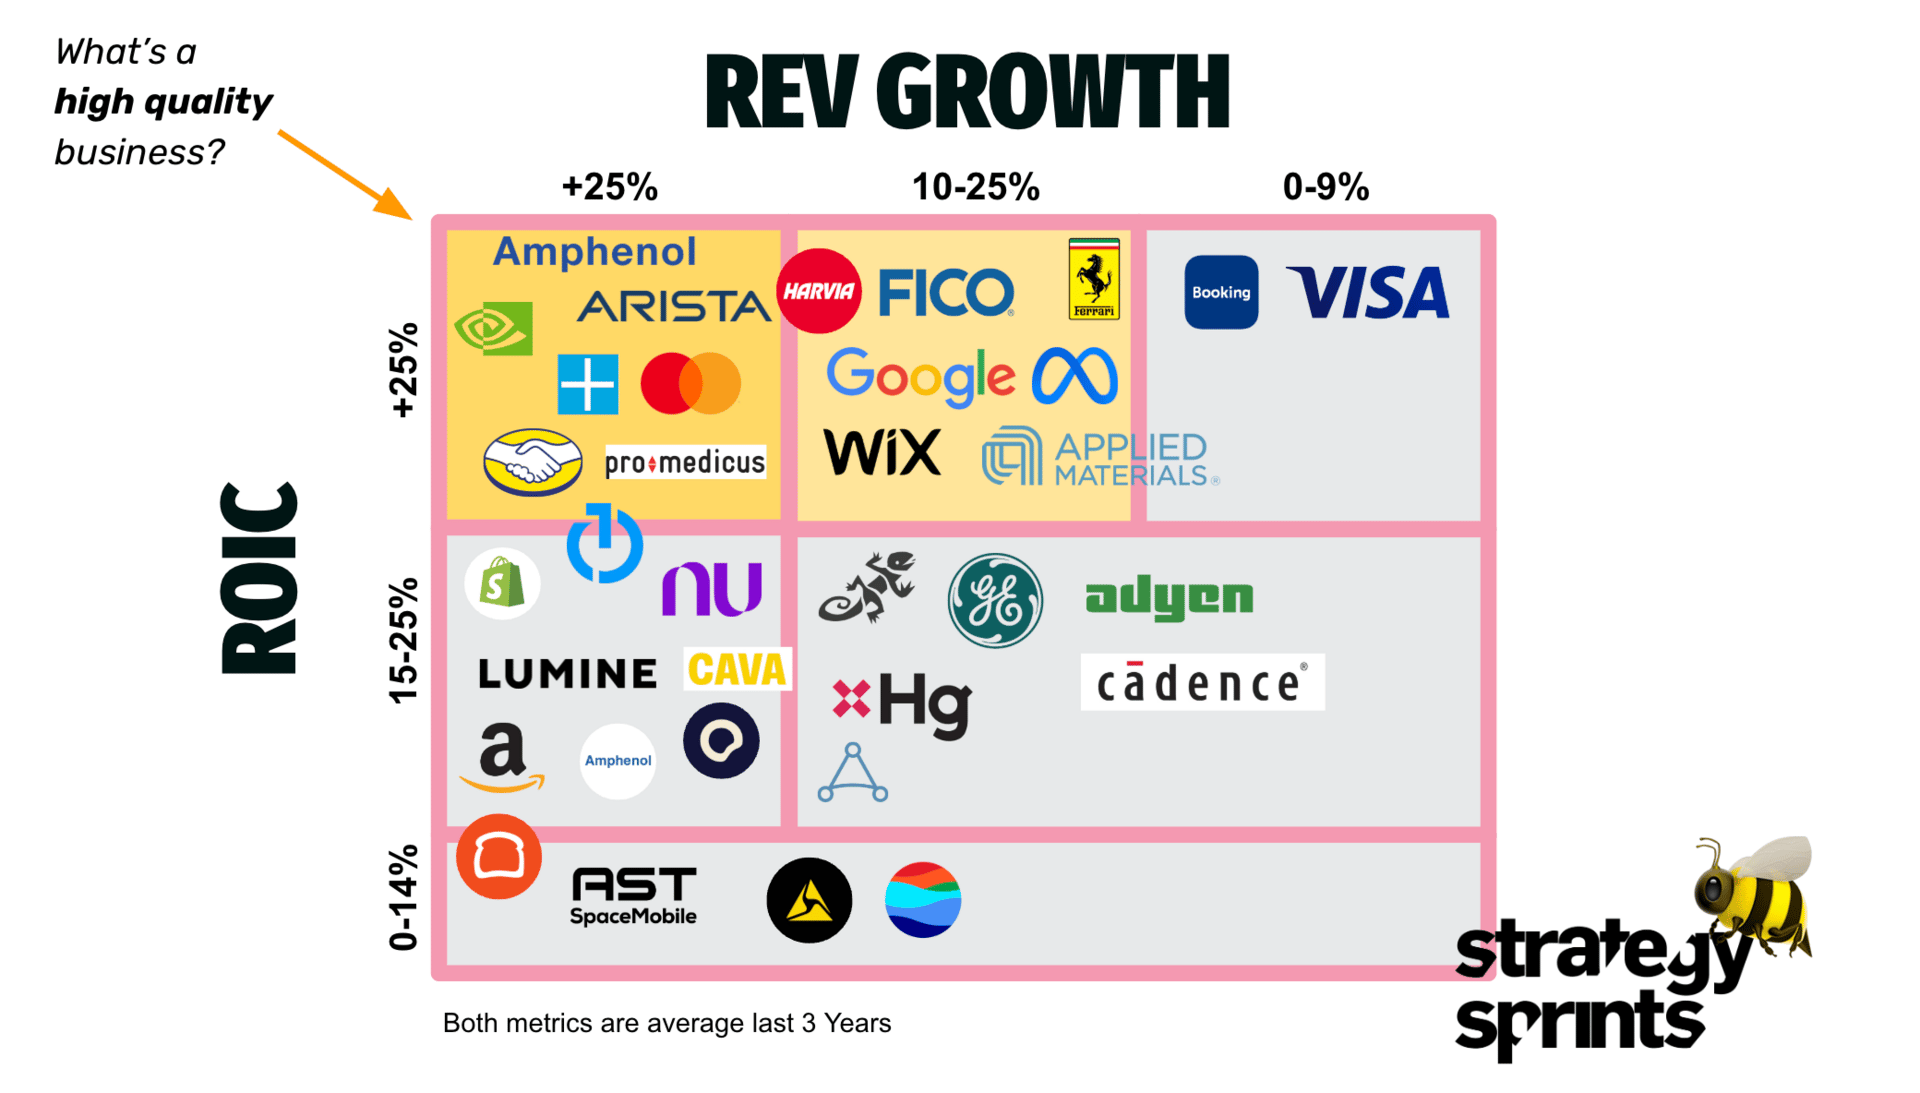
- APH
Amphenol was hiding in plain sight. Let’s dive into the valuation.
Stock Price: $105 USD | Market Cap: $127.05B | Assessment: Hold with Caution
Executive Summary
Amphenol Corporation represents one of the most compelling secular growth stories in today's interconnected world. With record Q1 2025 performance showcasing 33% organic growth and 23.5% operating margins, APH demonstrates the rare combination of defensive diversification and offensive growth capture that defines exceptional long-term compounders.
Investment Thesis: APH trades at a premium (30x NTM P/E) that we believe is justified by its unique decentralized business model, unmatched product portfolio breadth, and positioning at the epicenter of multiple structural growth drivers - particularly the AI revolution driving unprecedented demand for high-speed interconnects.
Recommendation: BUY with a 12-month price target of $85-90, representing 15-20% upside potential from current levels.
|
Company Overview & Business Model
The Amphenol Advantage
Amphenol operates as a federation of 140+ independent businesses under a corporate umbrella - a truly unique structure in the industrial sector. This decentralized "entrepreneurial" model provides:
Agility: Local decision-making enables rapid response to market changes
Diversification: Exposure across defense, IT datacom, industrial, automotive, and communications
Scalability: Proven ability to integrate acquisitions while maintaining entrepreneurial culture
Resilience: Geographic and end-market diversification provides downside protection
Revenue Composition (Q1 2025)
IT Datacom: 33% (fastest growing, +134% YoY)
Defense: 9% (+21% YoY growth)
Industrial: Stable growth trajectory
Automotive: Recovering from cyclical lows
Communications Networks: Enhanced by Andrew acquisition
|
Financial Performance Analysis
Q1 2025 Highlights: Record Breaking Performance
Revenue Growth:
Total sales: $4.81B (+48% YoY, +33% organic)
Record quarterly performance across all metrics
Book-to-bill ratio: 1.1x indicating strong forward demand
Profitability Metrics:
Adjusted operating margin: 23.5% (vs 21.0% prior year)
Adjusted EPS: $0.63 (+58% YoY)
Operating leverage: 250bp margin expansion YoY
Capital Efficiency:
ROIC: 15% (above 5-year average of 13%)
ROE: 27% (above 5-year average of 26%)
Free cash flow: $580M (79% of net income)
ROIC Analysis Framework
Using the project knowledge ROIC framework, Amphenol demonstrates characteristics of both differentiation and operational efficiency:
ROIC = NOPAT Margin × Asset Turnover
NOPAT Margin: ~17-18% (premium pricing through differentiation)
Asset Turnover: ~0.85x (capital efficient manufacturing model)
Combined ROIC: 15%+ consistently above cost of capital
This positions APH favorably within the electrical equipment sector, which historically generates median ROICs in the 8-12% range according to industry benchmarks.
|
Competitive Analysis
Industry Landscape
The interconnect industry features several key characteristics:
High barriers to entry: Complex engineering requirements, extensive testing/qualification
Customer stickiness: Design-in cycles create multi-year revenue visibility
Fragmented competition: No single dominant player across all end markets
Key Competitors
1. TE Connectivity (TEL)
Similar size and scope, more automotive exposure
Higher automotive cyclicality risk
Less AI/datacenter exposure
2. Molex (Private - Koch Industries)
Strong in automotive and industrial
Limited public financial transparency
Smaller scale in high-growth markets
3. Foxconn/Hon Hai
Primarily contract manufacturing focus
Less diversified end-market exposure
Geographic concentration risk
4. Specialized Players
Infineon (automotive focus)
Broadcom (silicon/RF focus)
Various niche connector specialists
Competitive Advantages
1. Unmatched Diversification
140+ business units across multiple end markets
Geographic diversification (40+ countries, 300+ facilities)
Product complexity spanning power, high-speed, fiber optic
2. AI Revolution Positioning
~67% of IT datacom growth from AI applications
"Disproportionate share" of AI interconnect market
Full-stack exposure from hyperscalers to chip manufacturers
3. Acquisition Excellence
15 acquisitions in past 9 quarters
Proven integration track record
Platform for consolidating fragmented markets
4. Operational Excellence
Incremental margins >25% (above historical 25% target)
Flexible cost structure enables margin expansion
Strong balance sheet (1.2x net leverage)
|
Valuation Analysis
1. Discounted Cash Flow (DCF) Model
Base Case Assumptions:
Revenue CAGR: 8-10% (2025-2030)
Operating margin expansion: 23.5% → 25% by 2030
CapEx as % of sales: 4-5% (elevated near-term for AI capacity)
Tax rate: 21%
WACC: 9.5%
Terminal growth rate: 3%
2. Sum-of-the-Parts Valuation
Given Amphenol's diversified business model, a sum-of-parts approach provides additional valuation perspective:
IT Datacom (33% of revenue, ~$6.4B annual run-rate)
Multiple: 6-7x sales (high-growth, AI exposure)
Value: $38-45B
Defense (9% of revenue, ~$1.8B annual)
Multiple: 4-5x sales (stable, government contracts)
Value: $7-9B
Industrial/Auto/Other (58% of revenue, ~$11.2B annual)
Multiple: 3-4x sales (cyclical but stable)
Value: $34-45B
Total Enterprise Value: $79-99B Midpoint: $89B Less Net Debt: $5.5B Equity Value: $83.5B SOTP Price Target: $88
3. Exit Multiple Valuation
Comparable Trading Multiples:
TE Connectivity: 25x P/E
Industrial peers average: 22-28x P/E
Premium for growth/diversification: 10-15%
Exit Multiple Analysis (2026E Earnings):
2026E EPS estimate: $3.20
Target multiple: 27x (premium to peers)
Exit value: $86
Average of All Methods: $86
|
Investment Risks
Cyclical Risks
AI demand sustainability: Current growth rates may moderate
Industrial cyclicality: Europe still showing weakness
Automotive recovery timing: Uncertain recovery trajectory
Operational Risks
Supply chain disruption: Dependence on Asian manufacturing
Tariff impacts: Potential margin pressure from trade policies
Integration risk: Ambitious M&A pace may strain execution
Valuation Risks
Multiple compression: High valuation vulnerable to sentiment shifts
Growth disappointment: Premium multiple requires continued execution
Capital allocation: Heavy CapEx requirements for AI growth
Catalysts and Timeline
Near-term Catalysts (6-12 months)
Continued AI datacenter build-out driving IT datacom growth
Andrew acquisition synergies and integration success
Industrial market stabilization in Europe
Margin expansion from operating leverage
Medium-term Catalysts (1-3 years)
AI infrastructure investment normalization at higher baseline
Automotive electrification acceleration
Defense spending increases globally
M&A opportunities in fragmented markets
Current trading metrics reveal stretched valuation
At $105 per share, Amphenol commands a $127.05 billion market cap with an enterprise value of $132.56 billion. The company trades at 39.2x forward P/E based on 2025 consensus earnings of $2.68, representing a 101% premium to competitor TE Connectivity's 19.51x multiple. More concerning, the 6.6x EV/Sales ratio reflects a 105% premium to TE Connectivity's 3.23x, positioning Amphenol well above historical connector industry norms of 3-4x.
These metrics underscore the market's enthusiasm for Amphenol's AI infrastructure exposure, but create vulnerability to multiple compression. The forward 2026 P/E of 36.1x offers modest improvement but remains elevated relative to the sector average of 27.77x, indicating limited valuation relief even with strong earnings growth.
|
Valuation disconnect creates limited upside potential
The current $105 price represents a significant 25% premium over the previous DCF valuation of $84 and 19% premium over the sum-of-parts analysis of $88. Multiple independent DCF models consistently indicate overvaluation, with Alpha Spread showing 61% overvaluation at recent prices and Simply Wall Street calculating fair value at just $64.90.
To justify the current $105 valuation, Amphenol would need to achieve 15-20% revenue growth annually for five years while maintaining 25% operating margins permanently - assumptions that border on unrealistic despite the company's strong execution. The bull case requiring 20% revenue CAGR and 4% terminal growth rates could support $100-120 fair value, but this scenario demands flawless execution across all business segments.
Investment recommendation shifts to Hold as the risk/reward profile has deteriorated. While the AI infrastructure thesis remains valid, the current price leaves limited upside with meaningful downside risk if growth moderates or margins compress toward historical norms.
|
Recent developments validate AI thesis but raise execution stakes
Amphenol delivered outstanding Q2 2025 results with revenue of $5.65 billion versus $5.04 billion consensus, representing 56.5% year-over-year growth and 41% organic growth. Adjusted EPS of $0.81 exceeded expectations by 22.73%, driven by explosive 91% growth in the IT datacom segment serving AI infrastructure demand.
The company's strategic positioning benefits from the $5.2 trillion AI infrastructure investment cycle projected through 2030, with data center CapEx expected to reach $1.1 trillion by 2029. Amphenol's record 25.6% operating margins demonstrate operational leverage and pricing power in this high-growth environment.
However, management's indication of potential margin normalization toward 30% conversion rates suggests current peak profitability may not be sustainable. Recent acquisitions including CommScope's Andrew business and LifeSync have contributed to growth but require successful integration to justify the premium valuation embedded in the stock price.
Risk scenarios outweigh upside potential at current levels
The probability-weighted expected return over 12 months is negative 7%, with upside scenarios requiring aggressive assumptions while downside risks appear more probable. Bull case scenarios targeting $115-130 depend on AI infrastructure acceleration beyond current projections and successful automotive electrification recovery, assigned just 30-35% probability.
More likely bear case outcomes targeting $70-85 reflect potential AI infrastructure efficiency gains, valuation multiple compression, or competitive pressure from TE Connectivity's market leadership. The 45% probability assigned to multiple compression risk acknowledges that Amphenol's premium valuation creates vulnerability to interest rate normalization or growth deceleration.
Key catalysts to monitor include Q3 2025 IT datacom guidance, CommScope acquisition integration progress, and sustainability of operating margins above 24%. The book-to-bill ratio trending below 1.0 suggests potential order normalization that could pressure near-term growth expectations.
Conclusion
Amphenol's fundamental business strength and AI infrastructure positioning remain compelling, but the current $105 price reflects optimistic assumptions with limited margin for error. The 25% premium to previous DCF targets and 19% premium to sum-of-parts analysis indicate fair value recognition has been achieved.
Recommended approach: Maintain existing positions but avoid new purchases at current levels. Better entry points likely emerge in the $90-95 range during market volatility, offering superior risk-adjusted returns while preserving exposure to the legitimate AI infrastructure supercycle. Current holders should consider position sizing discipline and potentially harvesting gains if Amphenol represents oversized portfolio allocation. Right now it sits on my watchlist, which you can access in real-time in our community.
Would you like to stay ahead of opportunities like this? Join our community where we share real-time trade alerts and deep-dive analyses of businesses with true competitive advantages. Don't just trade the market - invest in excellence.
Want to receive our trade alerts and detailed analysis in real-time? Join our community of value investors who understand that pricing power is the ultimate competitive advantage. Receive our trade alerts on your phone? Download the app here
|